Seasonal Fatigue Patterns and Schedule Density Effects on Performance Data in Elite Soccer and Basketball Leagues
Iris Friedrich · Aug 24, 2026
Seasonal Fatigue Patterns and Schedule Density Effects on Performance Data in Elite Soccer and Basketball Leagues
Elite soccer and basketball leagues operate on packed calendars where players face varying levels of match congestion, travel demands, and recovery windows that shift across the year, and researchers track these variables through metrics such as total distance covered, sprint frequency, shooting percentages, and error rates to map how fatigue accumulates.
Seasonal Fatigue Trends in Top Soccer Leagues
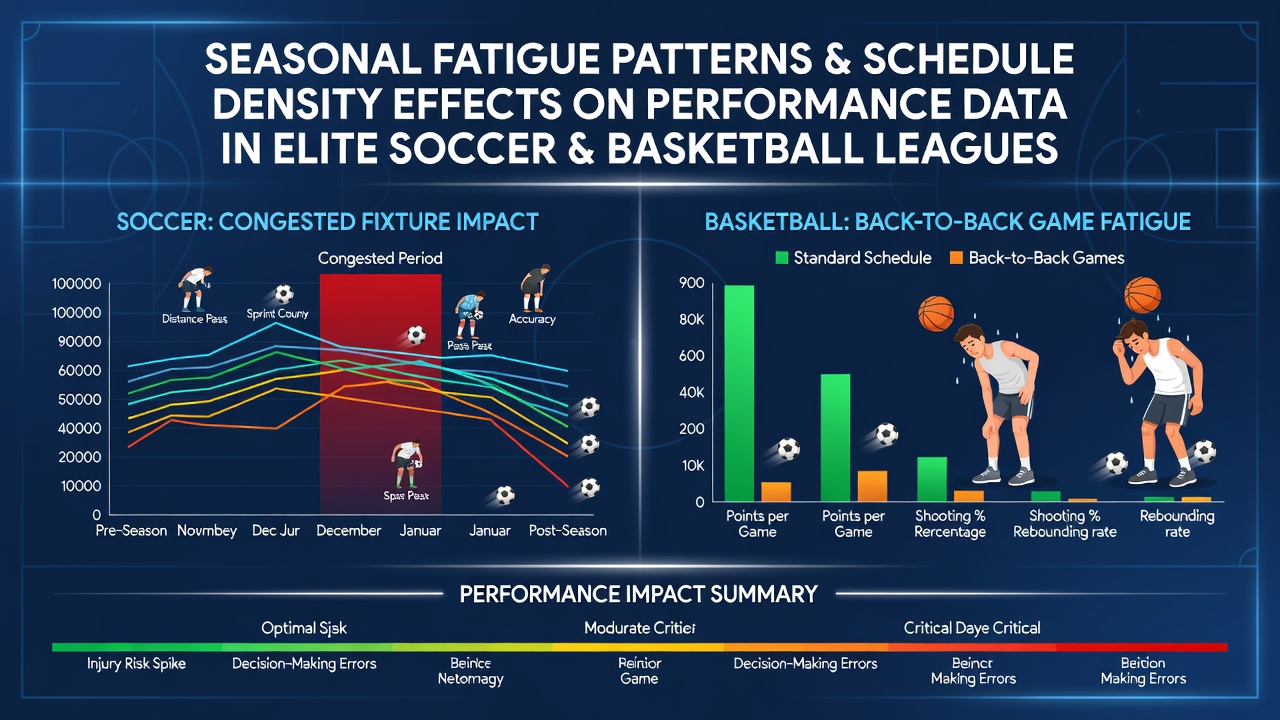
European soccer seasons typically run from August through May with additional cup fixtures and international breaks layered on top, so performance data collected by clubs and federations shows clear dips in high-intensity running after periods of three matches in seven days, especially during the winter months when pitch conditions add physical strain. Studies from sports science departments at universities in Germany and Australia indicate that midfielders in leagues like the Bundesliga and Serie A lose roughly 8 to 12 percent in total distance covered during the final third of the campaign compared with early-season baselines, while defensive units maintain more stable outputs because their role involves fewer explosive efforts. August 2026 marks the opening of the 2026-2027 domestic campaigns across Europe, and analysts already note that teams with deeper squads manage the initial schedule density better since they can rotate players before the first international window arrives.
Schedule Density Impacts in Professional Basketball
Basketball schedules in the NBA and EuroLeague create different fatigue profiles because teams play 82 regular-season games plus playoffs, often with back-to-back nights and cross-country flights that compress recovery time, and performance databases reveal elevated turnover rates and reduced three-point accuracy in the second half of back-to-backs. Data compiled by league statisticians shows that teams on the second night of such pairings win approximately 7 percentage points fewer games on average, while individual player tracking devices record drops in vertical leap height and lateral movement speed that persist into subsequent matches when rest intervals fall below 48 hours. Observers note that the condensed February and March periods, when teams juggle regular games with the All-Star break or cup competitions in Europe, produce the steepest cumulative fatigue curves according to longitudinal studies from Canadian and Spanish research groups.
Cross-Sport Comparisons and External Factors
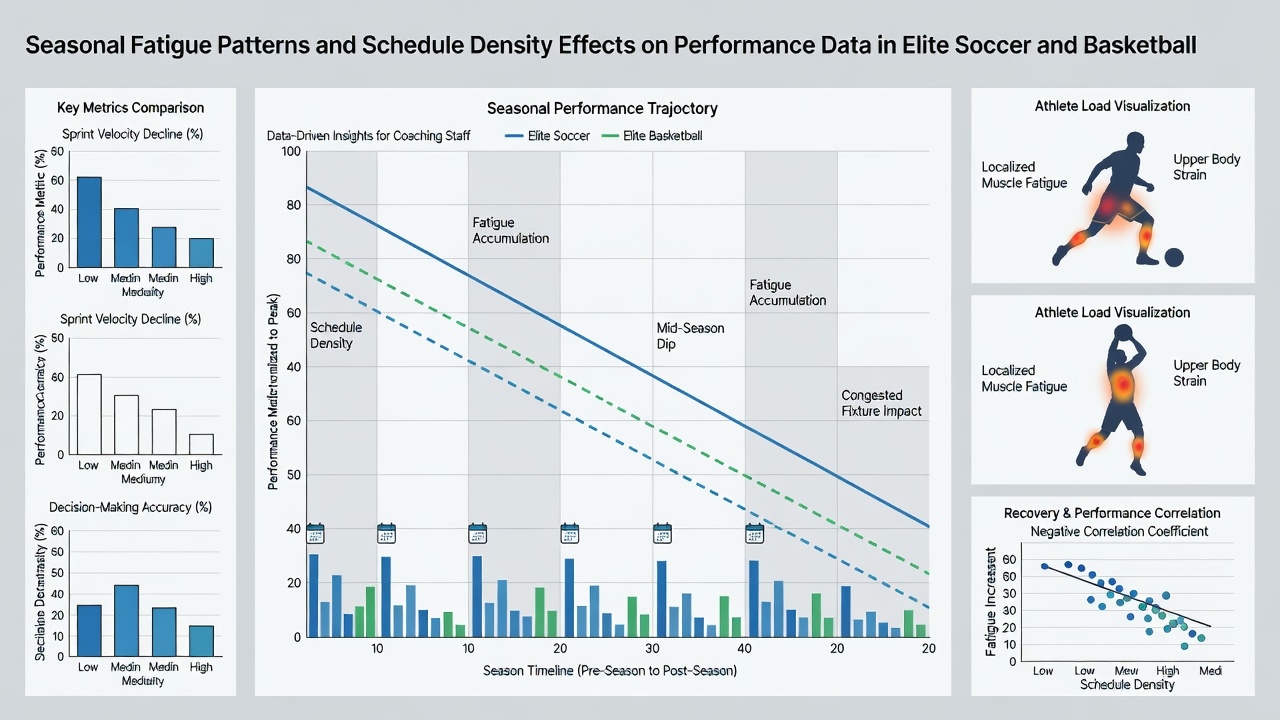
When researchers align datasets from both sports, patterns emerge around how schedule density interacts with seasonal phases: soccer shows gradual fatigue build-up tied to fixture pile-ups in December and March, whereas basketball exhibits sharper performance fluctuations linked to consecutive games and travel, yet both reveal that younger athletes recover faster than veterans when measured by heart-rate variability and neuromuscular tests. External elements such as climate, venue altitude, and even match timing further modulate these outcomes, with data from the Australian Institute of Sport highlighting how evening kick-offs in warmer months increase perceived exertion scores across both codes. Teams that employ load-management protocols, including strategic rest and individualized training blocks, demonstrate more stable performance metrics through the latter stages of their respective seasons according to reports issued by the European College of Sport Science.
Performance Data Tracking Methods
Modern analysis relies on GPS units, optical tracking systems, and wearable sensors that capture thousands of data points per match, allowing statisticians to quantify how schedule density correlates with declines in key indicators such as pass completion under pressure or contested rebound success, and these tools have become standard across elite clubs since the mid-2010s. Leagues publish aggregated figures that help identify at-risk periods, for instance showing that soccer teams playing midweek European matches followed by domestic league fixtures experience measurable drops in expected goals created during the subsequent 72 hours, while basketball organizations track similar decrements in effective field-goal percentage after dense stretches. The approach remains consistent across regions, with governing bodies in North America and Europe collaborating on standardized reporting frameworks that support comparative research.
Conclusion
Performance data across elite soccer and basketball continues to illustrate how seasonal fatigue and schedule density shape outcomes in measurable ways, with clubs and researchers using increasingly granular tools to monitor and mitigate these effects as calendars evolve into future seasons including the 2026-2027 cycle. Patterns identified through coordinated studies provide objective benchmarks that organizations apply when planning rotations and recovery strategies, ensuring that available evidence guides decisions around player workload throughout the year.